This section uses the example setup given in the Model Analysis Tools Intro.
Suppose that at your chemical plant you are assigned with finding how changing the pressure of your distillation column affects the relative volatility of your product. Aspen has its sensitivity analysis tool to accomplish just this. You tell Aspen to vary the pressure of the column and tell you what the relative volatility is at a bunch of different pressures. Then Aspen returns to you a table of pressures and the relative volatility at each pressure. Let’s try doing this in this section.
In the Simulation browser to the left, click on Model Analysis Tools → Sensitivity. Click on “New” in the resulting window and accept the default name “S-1”. The name does not matter as much here as it does for the Calculator block.
Vary
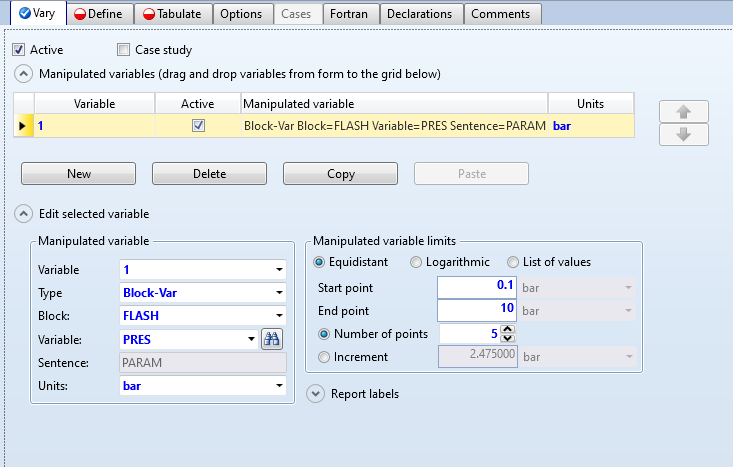
The first tab that Aspen takes you to is the Vary tab. Here, you will tell Aspen what variable you wish to vary. Click on “New”, then under “Manipulated Variable”, select Block-Var, FLASH (or the name of your block), and PRES for the three dropdown menus.
For “Manipulated variable limits”, we are telling Aspen what ranges you want to use for your pressure and how many points on the table you want. Let’s say that we are varying our pressure from 0.1 to 10 bar and that we want to try out 5 different pressures. Enter this data into the section as 0.1, 10, and 5 for Start point, End point, and Number of points respectfully.
At this point, your tab should look like this:
Your input should be complete. Next, click on the Define tab.
Define
In this section, Aspen wants you to define what your dependent variable is, or what you want to see change through varying your pressure. This variable can be any variable that Aspen stores in its results, but since we calculated relative volatility in the last section using our calculator block, we can use our calculator result to see how the relative volatility changes.
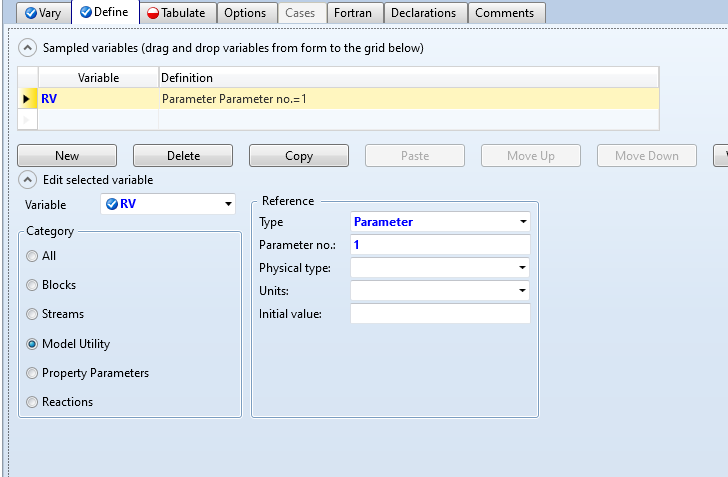
In the Define tab, click “New” and then enter “RV” for the variable name. Since we defined “RV” in the calculator section as a parameter, select Model Utility under “Category” and under “Reference” select Parameter under Type and enter 1 for Parameter no. (remember that in the last section, we defined RV as parameter no. 1).
Your Define tab should look like this when the input is complete:
Next, select the Tabulate tab.
Tabulate
In this tab, all you need to do is hit the “Fill variables” button. Now RV will be displayed in a table format when you run your simulation.
Your required input is complete for the sensitivity, so hit Run in the top left.
Display Results
To find your results, go to Model Analysis Tools → Sensitivity → S-1 → Results. In the “Summary” tab, your results should appear.
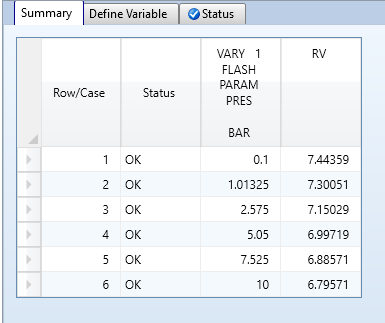
The last two columns show your results. The “Row/Case” column enumerates every one of your cases. The “Status” column tells you whether the simulation ran successfully at those conditions. Sometimes, your simulation might shut down, dry up, or fail at particular operating conditions, and Aspen will tell you if those conditions work or not for your column.