Introduction
One of Aspen’s most powerful functionalities is being able to optimize the initial conditions that you gave for your model to find the specifications that you want out of your process. These specifications could be things like yield, purity, or relative volatility of your product stream. These functionalities will be referred to as model analysis tools.
Aspen’s model analysis tools are powerful because they allow you to guess the initial conditions for your process. For example, say you want 99% purity in your column, but you are not sure what column pressure gets you to this purity. You can provide an initial guess for your column pressure to run your simulation and then, using Aspen’s model analysis tools, you can change that column pressure to obtain 99% purity.
The three main model analysis tools that Aspen has are:
- Calculator - Takes a specific result from your simulation and uses it to calculate a specific value, i.e. uses the pressure of your resulting column to calculate the relative volatility.
- Sensitivity - Takes a specific result from your simulation and alters it for different values of a variable, i.e. alters the pressure of a distillation column and sees how that pressure affects the relative volatility of the column.
- Design Spec - Takes a specific result from your simulation and alters it to obtain a specific value that you want out of the column - i.e. alters the pressure of a distillation column to see what pressure gives you 0.4 relative volatility.
This section of the tutorial will describe how to use these tools for your project.
Example Setup
For the model analysis tools section, I will set up a simple distillation column to separate ethanol and water. In the Properties pane, add components Ethanol and Water under Components and add NRTL as your base method in Methods. Remember to select the Binary Interaction file under Methods → Properties → Binary Interaction to load the thermodynamic data. Run your properties pane.
In the main flowsheet, I will use the Flash2 block under “Separators” in the Model Palette. Add a feed, overhead, and bottoms stream to the Flash2 block.
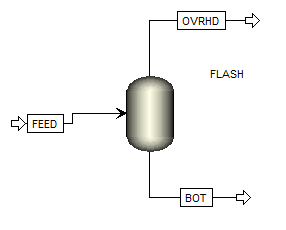
In the Streams tab, specify 100 kmol/hr for your feed stream. For “Flash Type”, select Vapor Fraction and Pressure. Enter 0 for the Vapor Fraction and 1 atm for the Pressure. (A 0 vapor fraction is commonly also referred to as the bubble point). Select Mole-Frac under “Composition” and enter ethanol as 0.15 and water as 0.85.
In the Blocks tab, specify 1 atm for the pressure and 0.15 for the vapor fraction of the flash block.
Your simulation should be ready to run. Click Run in the top left and check your stream results with mine under Results Summary → Streams.
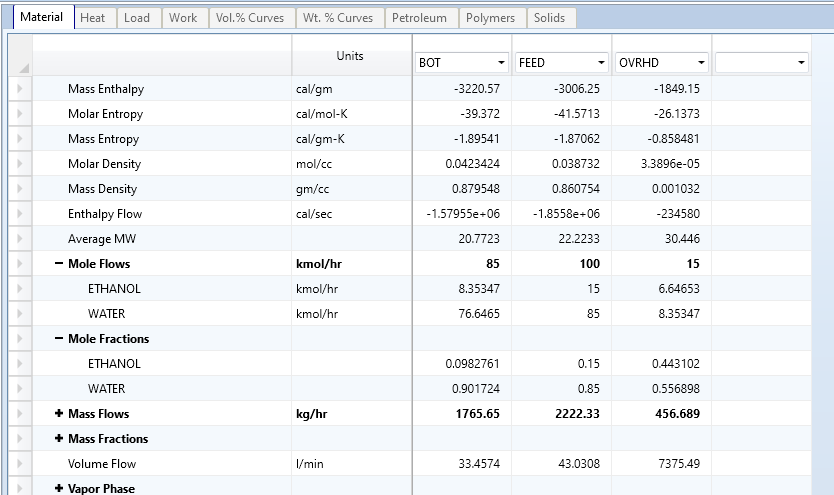
Save this simulation and use it when browsing through the rest of the sections in Model Analysis Tools to check your results with mine.